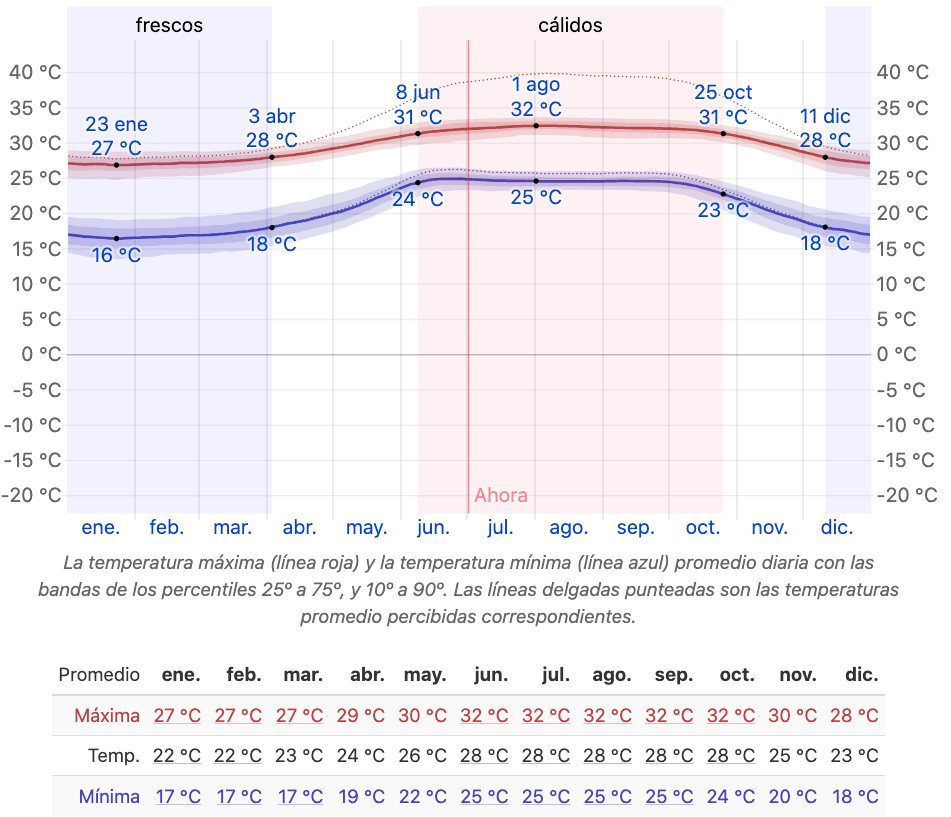
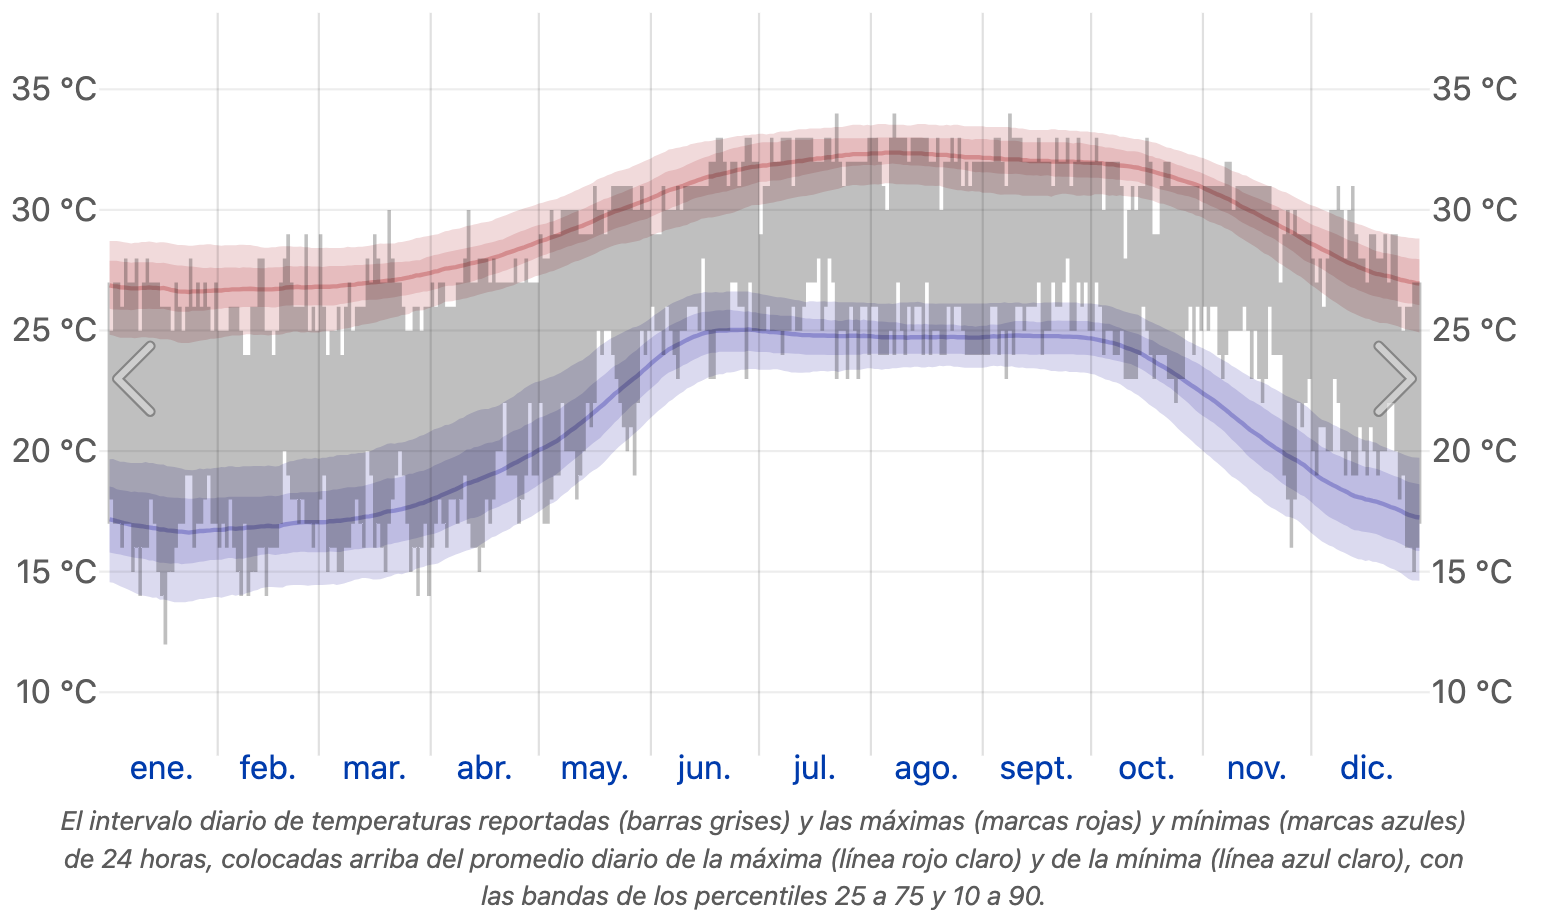
In this Annual Analysis of Temperatures in Puerto Vallarta, we explore the climate dynamics of one of the most charming tourist destinations in Mexico. This article details the maximum and minimum temperatures recorded throughout the year, providing an in-depth look at the fluctuations that Puerto Vallarta experiences. With graphs of historical data for 2023 and 2024, readers will be able to visualize how the weather varies month to month, allowing for better planning for tourists and local residents.
These graphs illustrate not only average daily temperatures, but also the extremes that can be reached during certain periods of the year. This information is crucial to understanding how climate impacts daily life and economic activities in the region, such as tourism and agriculture. Additionally, knowledge of these temperature patterns helps local businesses and event organizers choose the best times for their activities, ensuring the comfort and safety of all participants.
Annual temperatures in Puerto Vallarta in 2023

Average

Annual Average Temperature in Puerto Vallarta in 2023

Graphics courtesy of © WeatherSpark.com
Disclaimer
The information on this site is provided as is, without warranty as to its accuracy or suitability for a particular purpose. Climatological data is prone to errors, discrepancies and other defects. We assume no responsibility for decisions made based on the content of this site.


